


Figuring out what you pay for a public company was the easy part – step one. Nevertheless, going through the deep meaning of market capitalization first was crucial for realising that you are buying a portion of a business and becoming a partial owner. Now, it’s time to figure out what the business is really worth, so you can know whether you are buying for cheap or if you are overpaying.
Public companies should not be treated differently to private companies. The intrinsic value of a company is mainly based on the future business profits attributable to the shareholder. The problem for companies, public or private, is that future earnings are not known in advance. More or less, you know that a house will offer you a certain amount of rent, which won’t change wildly. On the contrary, a company can multiply its earnings in a few years time, can turn to losses, or even go bust.
Therefore, you should not expect accuracy, and anyway good investing doesn’t need complex maths. Theoretically, the intrinsic value equals the cash flows that the asset, whether it’s a house or a business, will offer to the owner in perpetuity, discounted to the present. This technical term, “discounted”, should not scare you. Let’s see what it means.
An asset offering you $1,000 in the next year and one offering $1,000 in thirty years are not the same. For every additional year of waiting, some discount is applied. If the discount rate is 10%, $1000 in the next year equals $909 in present value, but $1000 in the 30th year equals only $57 in present value. Intuitively, the $1000 in 30 years is only worth $57 today due to inflation, opportunity cost, and other factors. Mathematically, if you take $57 and grow it each year at 10% (our discount rate), you will have $1000 in 30 years.
To reverse this process, they use a model called the DCF (Discounted Cash Flow) model:
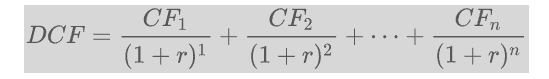
A DCF is accurate as a calculation. What isn’t accurate is some of the inputs, because they are assumptions for the future. A 5%,10%, or 20% earnings growth for the next few years can bring a wildly-diverging difference on these expected cash flows. A DCF may fool you into believing that you are precise, because you use complex calculations and a sound method, but you have to come to terms with the fact that humans cannot predict the inputs accurately, and therefore we cannot predict the future.
It’s funny that DCF taught in the best universities is almost never used by great value investors, as Buffett and Munger have repeatedly admitted, like here and here. Munger has said:”Warren talks about these discounted cash flows. I’ve never seen him do one”
Not because the knowledge of it is not useful, but because when something is a real bargain, it screams to you. If you have to do complex calculations to figure it out, then it’s probably not a bargain. And here is a funny video from Steve Gamble, answering an attendee of our London Value Investing Club event. He refers to this quote originally by Benjamin Graham: “You don’t need to know a man’s weight to know that he’s fat”
To make it well understood, imagine that an oracle back in 2013 revealed to you the financial performance for all public companies for the next 10 years. Would you need a DCF to know that those companies destined to turn to losses, give no dividends and finally go bust, are worth 0? Would you need a DCF to know that a company having traded for only a few million, but was destined to achieve profits in the billions, could be bought for peanuts and be an amazing investment?
Having an oracle as your friend and foresight as a companion, an approximate estimation would be enough to make you rich. So, the game is not about hitting the target spot on, but about understanding the big picture. It’s about having an idea on how the future will probably evolve, and some common sense on what is a sensible valuation, according to different business outcomes.
“It’s better to be approximately right than exactly wrong” – Carveth Read
I am not preaching to stop doing DCFs, but I am explaining to you why the greatest investors are okay without Excel, and why you should not think of investing as a game of complex calculations and preciseness. Embrace this uncertainty we cannot overcome and read some of the ideas that might help you think about approaching fair valuations in ways possible for humans to think.
THE THREE PILLARS OF VALUE
In my practical experience of seeking value, I would divide value into the three following pillars. It’s more abstract and less precise compared to a DCF, but it is not necessarily less accurate and has the advantage that it can better be conceived by the human brain.
Static Value
If you add what a company owns (assets), and subtract what it owes (liabilities), a net value comes out. It’s known by different names: Book Value, Equity, or Net Assets Value. The Balance Sheet is the table where many different lines of liabilities and assets appear, and it shows the composition of the book value. An experienced investor can do some adjustments on elements thought to be overrepresented or underrepresented. This is why I used the abstract term, Static Value, for the title of this section instead of Book Value, which companies publish.
Static Value has two big pros: it doesn’t fluctuate very much, and less experienced investors can better approach it. However, the big limitation is that it doesn’t take into account the future, like the other two pillars of value do.
Investors who focus on the book value very often search for companies that trade below this. So, if a company has $100 million of net assets, they aim to pay much less. If they find it with a market capitalization of let’s say $60 million, they may be happy to buy.
The most common metric they use is Price to Book Value. For the example in the last paragraph, it equals 0.60. Basically they buy $1 of net assets for 60c. The calculation is easy:
Price to Book = Market Capitalisation / Book Value
Of course, most investors do not judge value on this one metric and take into account other quantitative or qualitative data or metrics. For example, cash has a certain value, but inventory, receivables, or goodwill may have questionable value. There’s also debt and net losses.
A lot of debt means higher leverage, and this makes equity value fragile. Plus the interest paid affects net margins, and can increase the chance of the company turning into losses.
Moreover, a loss-making company can destroy its equity value. Loss can churn the equity value, and this last part is related to the following section, which deals with the earnings or losses.
As a quick example, imagine the company mentioned above with $100 million of net assets, $40 million of which are “goodwill”, and expecting $10 million in losses soon. The tangible book value is $60 million (the value of “hard assets”), and the loss will bring this down to $50 million. If you buy before the loss is realised, you are essentially buying this $50 million of tangible equity by paying $60 million in market cap. You can’t call this a bargain, especially if the quality of the company is not great.
So, if you solely search for companies with a low price to book, without checking anything else, you will mostly be involved in terrible situations. By applying additional qualitative or quantitative filters, you will be able to buy for cheap, and also filter out some companies that are cheap for a reason.
Earnings Value
Imagine a simplified company that receives milk and produces yoghurt. If it can profitably engage in this activity, it can then either distribute this profit to the shareholders or retain the profit, which in turn increases the equity held by shareholders. The great significance of earnings is that it’s a recurring event, unlike book value.
For example, if this company has an equity value of $5 million, and produces $1 million of earnings each year, after 5 years, by retaining such earnings, it will end up with an equity value of $10 million. If it chooses to distribute all of them as dividends, shareholders will get $5 million in their pockets, and keep owning $5 million of equity value in the company. Either way, earnings are attributable to the shareholders.
However, a loss making company subtracts equity value. For the company with $5 million equity, 5 years of $1 million yearly losses are enough to wipe out the equity. In most cases it will be difficult for the company to survive after this point.
These examples are oversimplified but show that the earnings are more significant than the static value. And this is because this type of value recurs and over time has a larger impact. The big problem is that earnings fluctuate, sometimes wildly. Investors should make adjustments to deal with how companies present earnings and other factors like cyclicality and non-recurring items, and investors should try to normalise them.
These adjustments are much more challenging than those needed for the balance sheet elements. It’s not always easy to know in advance whether a downturn is cyclical or secular in nature. Experience is crucial, and again not always enough, because many qualitative factors and business characteristics judge the sustainability or course of the future earnings.
Investors focusing on earnings check for metrics like the P/E or the Dividend Yield.
If the company earns $10 million per year, and trades for a market cap of $120 million, the P/E (Price/Earnings) is $120m / $10m or 12. P/E is how many multiples you pay for the yearly profits of a company. Now, let’s say, this company retains $4 million and distributes $6 million to the shareholders as dividends, then the investors receive 5% on the current market cap value as dividends. This is the dividend yield.
Like other similar valuation metrics, the result is the same whether you calculate on a per share basis or for the whole company:
Dividend Yield = Dividend per Share / Price per Share = Total amount of Dividends Paid / Market Cap.
In our example, the company distributes $6 million, and the Market Cap (total price) is $120 million. So the dividend yield is 5%. The dividend yield increases when the company increases the dividend amount or the stock goes down, and decreases when the stock goes up or the dividend decreases.
Seeking this type of value, the focus diverts from the Balance Sheet towards the Income Statement. There you can find out how the revenue and different types of expenses lead to the bottom line, the earnings.
From another financial statement, the Cash Flow Statement, you get a better understanding of how the earnings convert to cash and where said cash is deployed. Are those cash flows used for CAPEX, acquisitions, or distributions to the shareholders in the form of dividends? This information can be revealing for the quality of earnings and the capital allocation strategy of the company. There are more details, which we will leave for another time.
Growth Value
So far, we have seen that the static value is easier to approach, but earnings are more important and exciting because it’s a recurring force. If earnings are a force that increases the equity value through time, growth goes one step further. Growth is a force that increases earnings. The impact is bigger than the other two pillars of value.
Imagine a company that earns $1 million, but grows this amount 20% per year. In the next year they will earn $1.2 million, and with the magic of compounding will end up earning $6.2 million in the 10th year. In the 20th year, this will be $38 million of annual earnings. A company with no growth at all will keep producing only $1 million per year.
Paying up for the growing company makes sense, and if we want to be honest we all have to admit that growth is the most determining factor in fair value. This is why startup companies, like CityFALCON, are valued based on their potential of capturing markets worth billions, rather than on today’s financial performance.
But, we have an issue here. If next year earnings are difficult to predict, take a moment to think of how difficult a 10-yr or 20-yr prediction is. What makes things even more difficult is that investors are already aware of the merits of growth, so in the public markets companies with great prospects and current growth already reflect this expectation to their price. As a consequence, if expectations for growth do not come true, the investor, who has paid an elevated price for value that will not materialise, will face losses.
The answer would be clear if we had to pick between a company A that earns $10 million per year, and is expected to grow 20% per year for the next decade, and a company B with the same earnings but no significant growth, provided that both trade for let’s say $150 million market cap. We all would go for the growth company A, right?
Again, if company A trades for $300 million, probably it makes sense to pay up, if we have strong conviction for this growth. We just have to be ready to lose if growth doesn’t come. The more we pay up, the more factors have to work out right for the equation to work for us. That’s why some great companies that actually grow but less than expected hurt investors that paid too much. This tends to happen when hype makes prices outrun reality.
On the other hand, people who bought Amazon paid a very low price compared to the current financial performance of the company. Of course, among thousands of companies, it’s not easy to identify Amazon and be right on it.
Growth is part of value, and it’s the most challenging part to approach. Of course there are metrics, similar to P/E, like the PEG (price to earnings growth), which take into account the growth, but they are very erratic because growth is subject to extreme changes. Based on a PEG of 1, if a company grows its earnings 20%, its fair valuation is 20 times its earnings. This is something that the investing great Peter Lynch has advocated as a rule of thumb. It’s true that past growth doesn’t equal future growth, but it does give us an idea for the company’s abilities in the future.
Growth investors also pay attention to the return on capital. There are many variations to measure it (ROE, ROIC, ROA). To keep it simple, when a company has a history of producing 20% on its equity (ROE), and can reinvest all earnings (incoming equity), at the same high rate, it can achieve an equivalent rate of growth, as explained below with an example
Growth = ROE × (1 – payout ratio)
The payout ratio is 0 when a company offers no dividends and reinvests all earnings to boost growth. It’s 1 when it distributes all earnings, which kills growth. This example explains why growth matches ROE when earnings are retained.
A ROE of 20% means that a company with $100 million of equity earns $20 million. Next year, equity, after retaining earnings, will be $120 million. A ROE of 20% this time will bring $24 million of earnings, and an equity of $144 million. By continuing that, you will notice that both equity and earnings grow 20% per year. This is a very simplistic example, but it may help you understand the concept.
Generally, it is better for a company with a low return on capital to offer dividends, while a company with a high return should re-invest the profits. That’s because the capital that stays in the company will compound at this high rate (to the benefit of shareholders), while the shareholders are unlikely to achieve 20% somewhere else on their own. Low ROE enterprises should pay dividends so shareholders can invest elsewhere for higher returns.
It’s rare for most companies to sustain a high rate of return for long. They mature and competitors copy their success. As a consequence, there is less they can invest at a high rate of return. This affects their growth.
Very successful investors, like Nicolas Sleep (check out his letters), who correctly identified Amazon and Costco, recognised qualitative factors, like values and other inner characteristics of the companies or their founders, that allowed them to sustain their competitive advantage and abnormal rates of return. In business, those factors are called economic “moats”.
Note that for these great investors, it isn’t the rising stock that excites them, and this is not what they call “growth”. A real growth long-term investor likes the increasing profits and prospects, and dislikes or ignores the rising stock. That’s because he is interested in buying these “diamonds” as cheap as possible, and not thinking primarily of selling them.
Combining the above
Investing and valuations are the intersection of science and art. Experience will make you have better judgement through the accumulation of real life examples. It’s fair for you to say, “I don’t have the experience, I came here to learn!”. You won’t get an easy answer, but there is something that you can do.
By studying the history of how the market capitalisation has unfolded for different companies in relation to their financial performance, you will firstly have a good sense of how businesses can possibly progress, and secondly how the market participants valued them, according to their static value, earnings, and growth prospects.
That’s a bit confusing, because so far there I’ve emphasised that you should distinguish price from value and now I’m telling you that price oscillates around value, and you may let it teach you something. Remember, your end goal is to exploit the differences between price and value. But to get the value right, you can study the historical relation of price and value.
The markets are on average efficient, but there are periods, or pockets of the market, where prices get distorted. This is why undervalued or overvalued stocks exist, because the market for psychological, structural, and other reasons overshoots or undershoots. The history of the market is the best teacher of fair value, when you keep in mind that it is sometimes right-ish, sometimes exactly right, and sometimes very wrong.
As you study the history, you will start noticing different eye-opening cases. Examples of excessive prices, followed by a collapse. Similarly, unviable high debt leading to bankruptcy or other fundamentals causing financial performance deterioration. Or stocks appearing cheap but only on the surface (value traps). Equally, you will find companies that were indeed cheap, or had great prospects, and you will verify how this finally was reflected in the market capitalisation, and how it led to big profits.
All these real examples will give you a sense of the fair value. Your brain will calibrate via long past data rather than by attending to the noise of current data. Current prices, for the whole market or a specific sector, may be skewed by overvaluation or undervaluation, and this can confuse you. You can’t see clearly when you are in a bubble or a depressed sector. Also, financial performance can be affected by cyclicality. So, both price and fundamentals are not so clear in the short-term.
But if you study dozens of companies for two decades, overvaluation and undervaluation will start becoming obvious to you. Obvious in retrospect, of course, but again this can be a big achievement, showing you have developed a sense of approaching the fair value. Use the history of the market to gain those decades of experience faster.
There are some methods and formulas that offer you a “fair value” calculation. Backtests show that they can outperform the market, even when they contain failures. So, some investors follow them, diversify a lot and become quants to beat the indexes. There is a great presentation on such methods from our last London Value Investing Event by Sak Shariff.
Even if you don’t follow this automated path, these methods will teach you something and will help you in your journey of becoming better in approaching the fair value. Having in mind that value derives from these three pillars, and that price is the market’s opinion that loosely follows this value, you will realise that you have to exploit its inefficiencies and not be tricked into following it.
Being able to distinguish those two, value and price, will accelerate your learning, and you will be able to see your gains or losses from a deeper perspective than just looking at paper prices going up and down.
Step Three, on how to compare value and price and act on it, is coming soon!
It seems easy, but it’s the one that people can’t follow. Don’t miss out! Follow us on social media (Twitter, Facebook) and check the blog periodically for updates. You can also sign up for our newsletter, which we publish a couple times a year about the tools we offer to help you be a better investor.
At CityFALCON, for each public company we have an Investor Relations and a Filings section. This is a place you can easily search and find past filings and reports for the companies you want to analyse. We are also in the process of adding fundamental data on our platform, among the news and analytics we already provide. We are your one-stop-shop for market information
DISCLAIMER
Content presented on our blog does not present any recommendation for stock transactions or financial information. Metrics, like the market capitalization, may contain errors. All investors are advised to conduct their own independent research into individual stocks before making an investment decision.
Leave a Reply